This post is based on the talk “From One Notebook to Many Reports: Automating with Quarto” delivered at SciPy 2025 by Charlotte Wickham. You can find the slides at cwickham.github.io/one-notebook-many-reports and example code at github.com/cwickham/one-notebook-many-reports.
The Problem: Repetitive Reporting
Would you rather read a generic “Climate summary” or a “Climate summary for exactly where you live”? Reports that are personalized to a specific situation increase engagement and connection. But producing many customized reports manually is tedious and error-prone.
Quarto solves this with parameterized reports—you create a single document template, then render it multiple times with different parameter values to generate customized outputs automatically.
A great example is the customized soil health reports from Washington Soil Health Initiative’s State of the Soils Assessment, presented at posit::conf(2023) by Jadey Ryan (watch on YouTube). Jadey demonstrated this approach using R and plain text Quarto files (.qmd).
This post shows you how to apply the same principles using Python: we’ll walk through converting a Jupyter notebook (.ipynb) into a parameterized report, then automating the generation of multiple customized outputs. Then I’ll give you some tips for making your reports look polished.
The Solution: Parameterized Reports
Start with a notebook
As an example, let’s start with a Jupyter notebook analyzing climate data for Corvallis, Oregon.
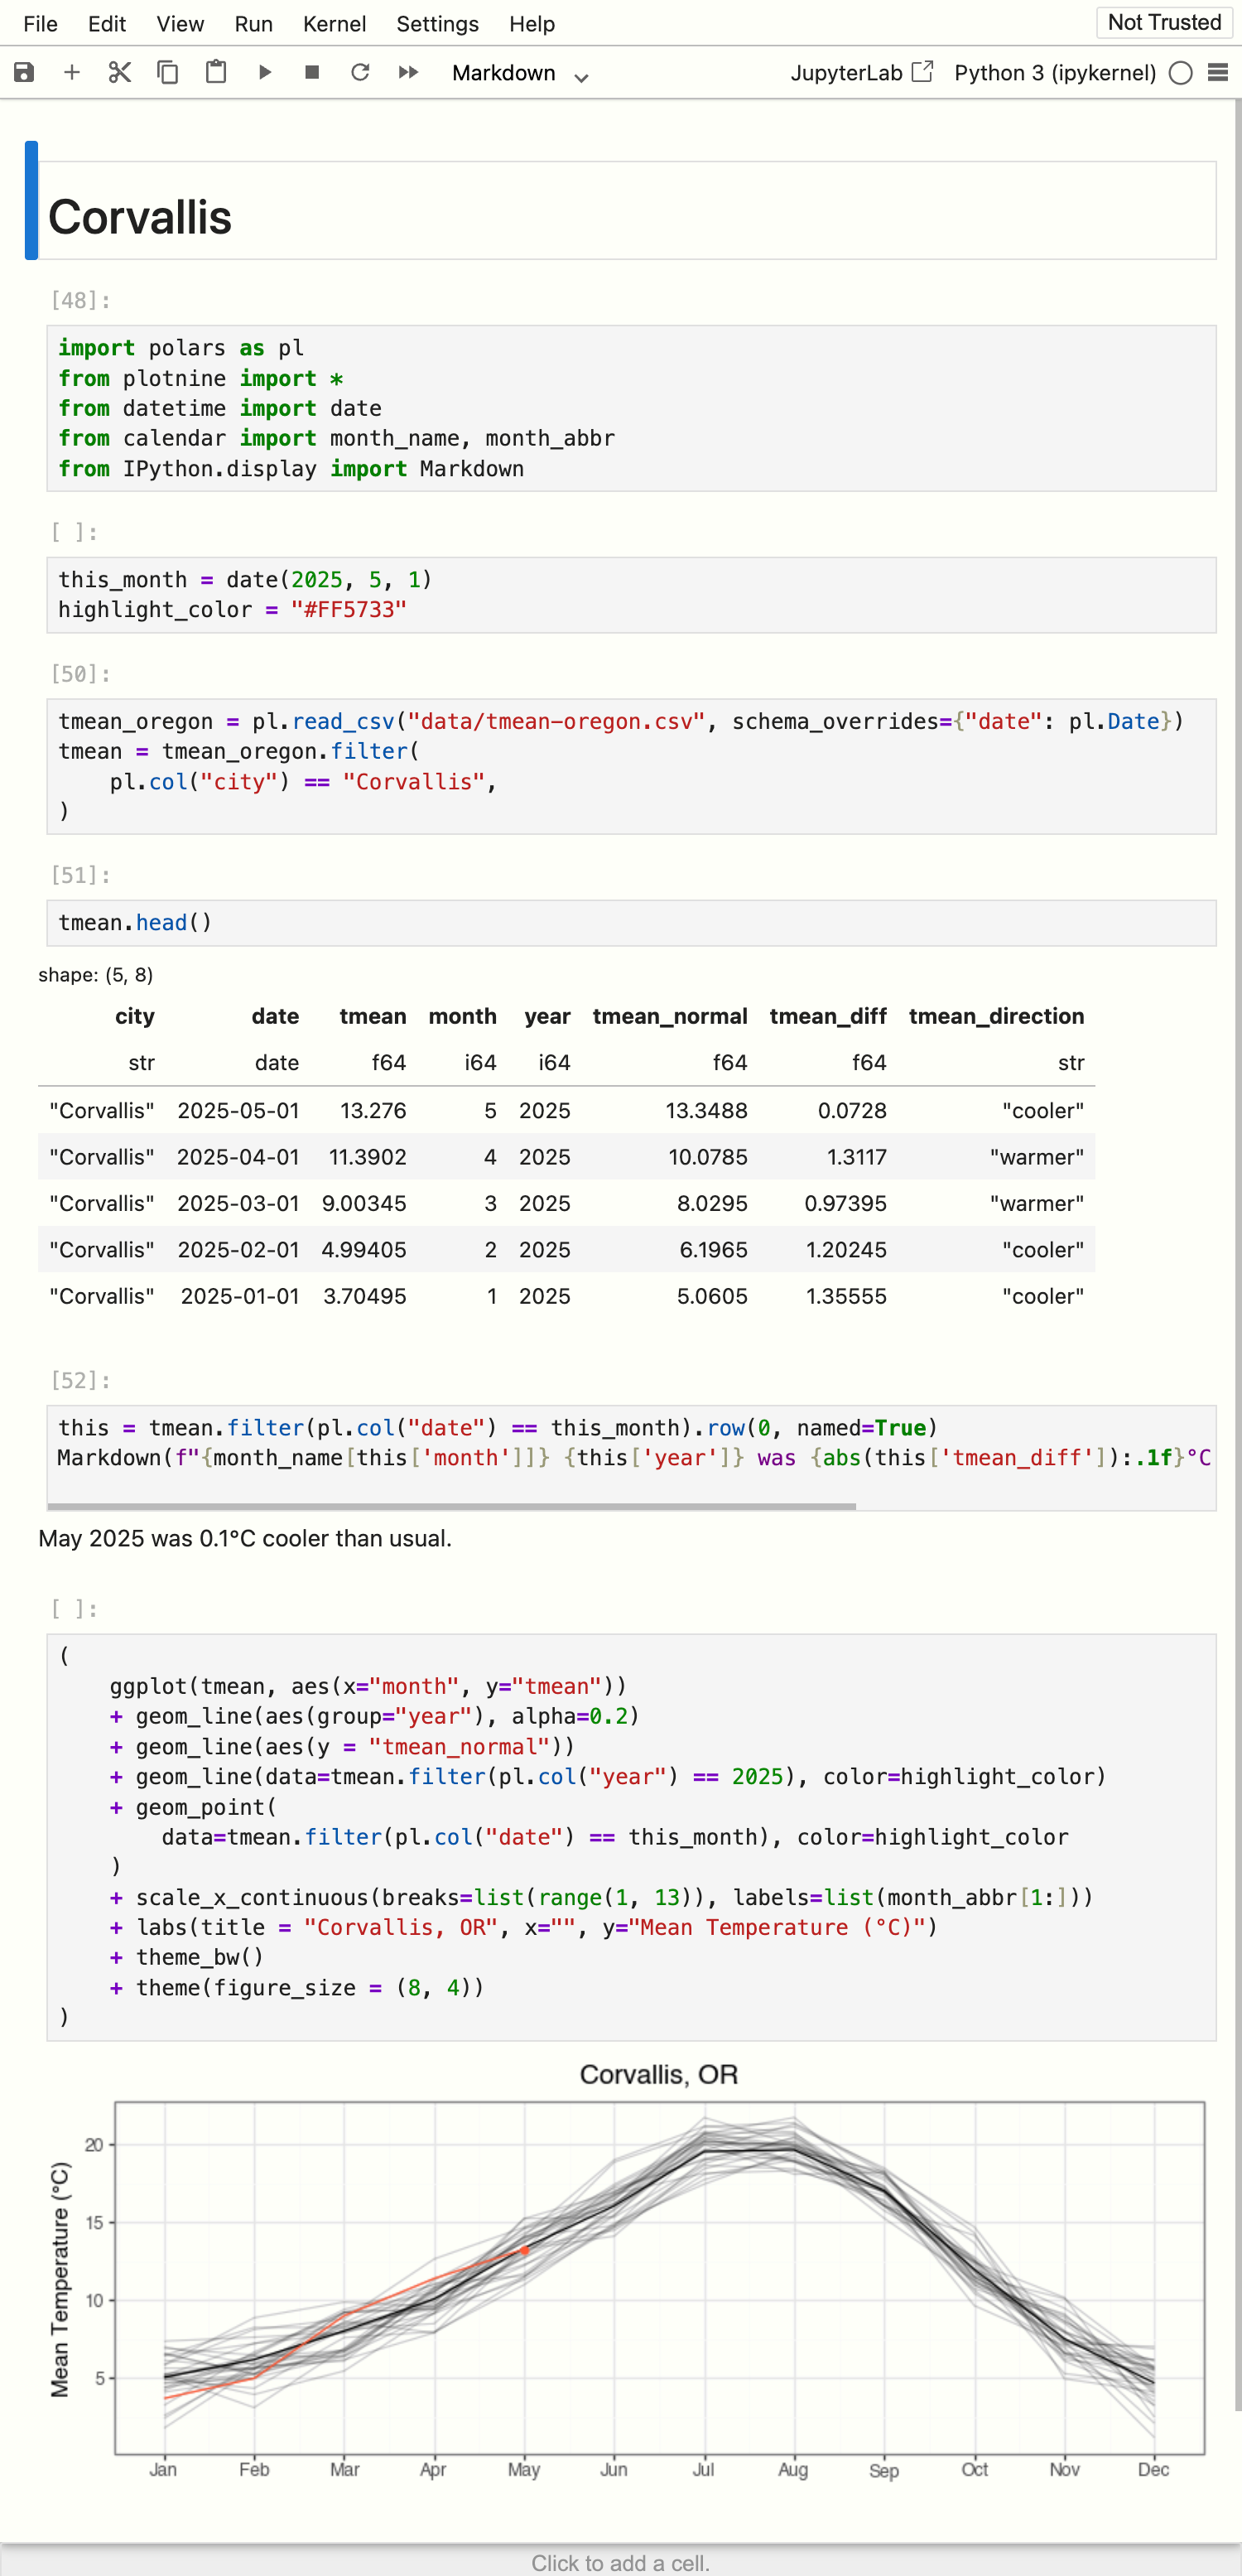
You can see the full notebook, corvallis.ipynb, on GitHub, but here are the key pieces:
The code cells import some data for all of Oregon, and filter it to just rows relevant for Corvallis, then produce a summary sentence and a plot.
The document options specify
echo: falseso no code appears in the final output, andformat: typstso the output is a PDF produced via Typst, a modern alternative to LaTeX.
This single notebook can be rendered with Quarto:
Terminal
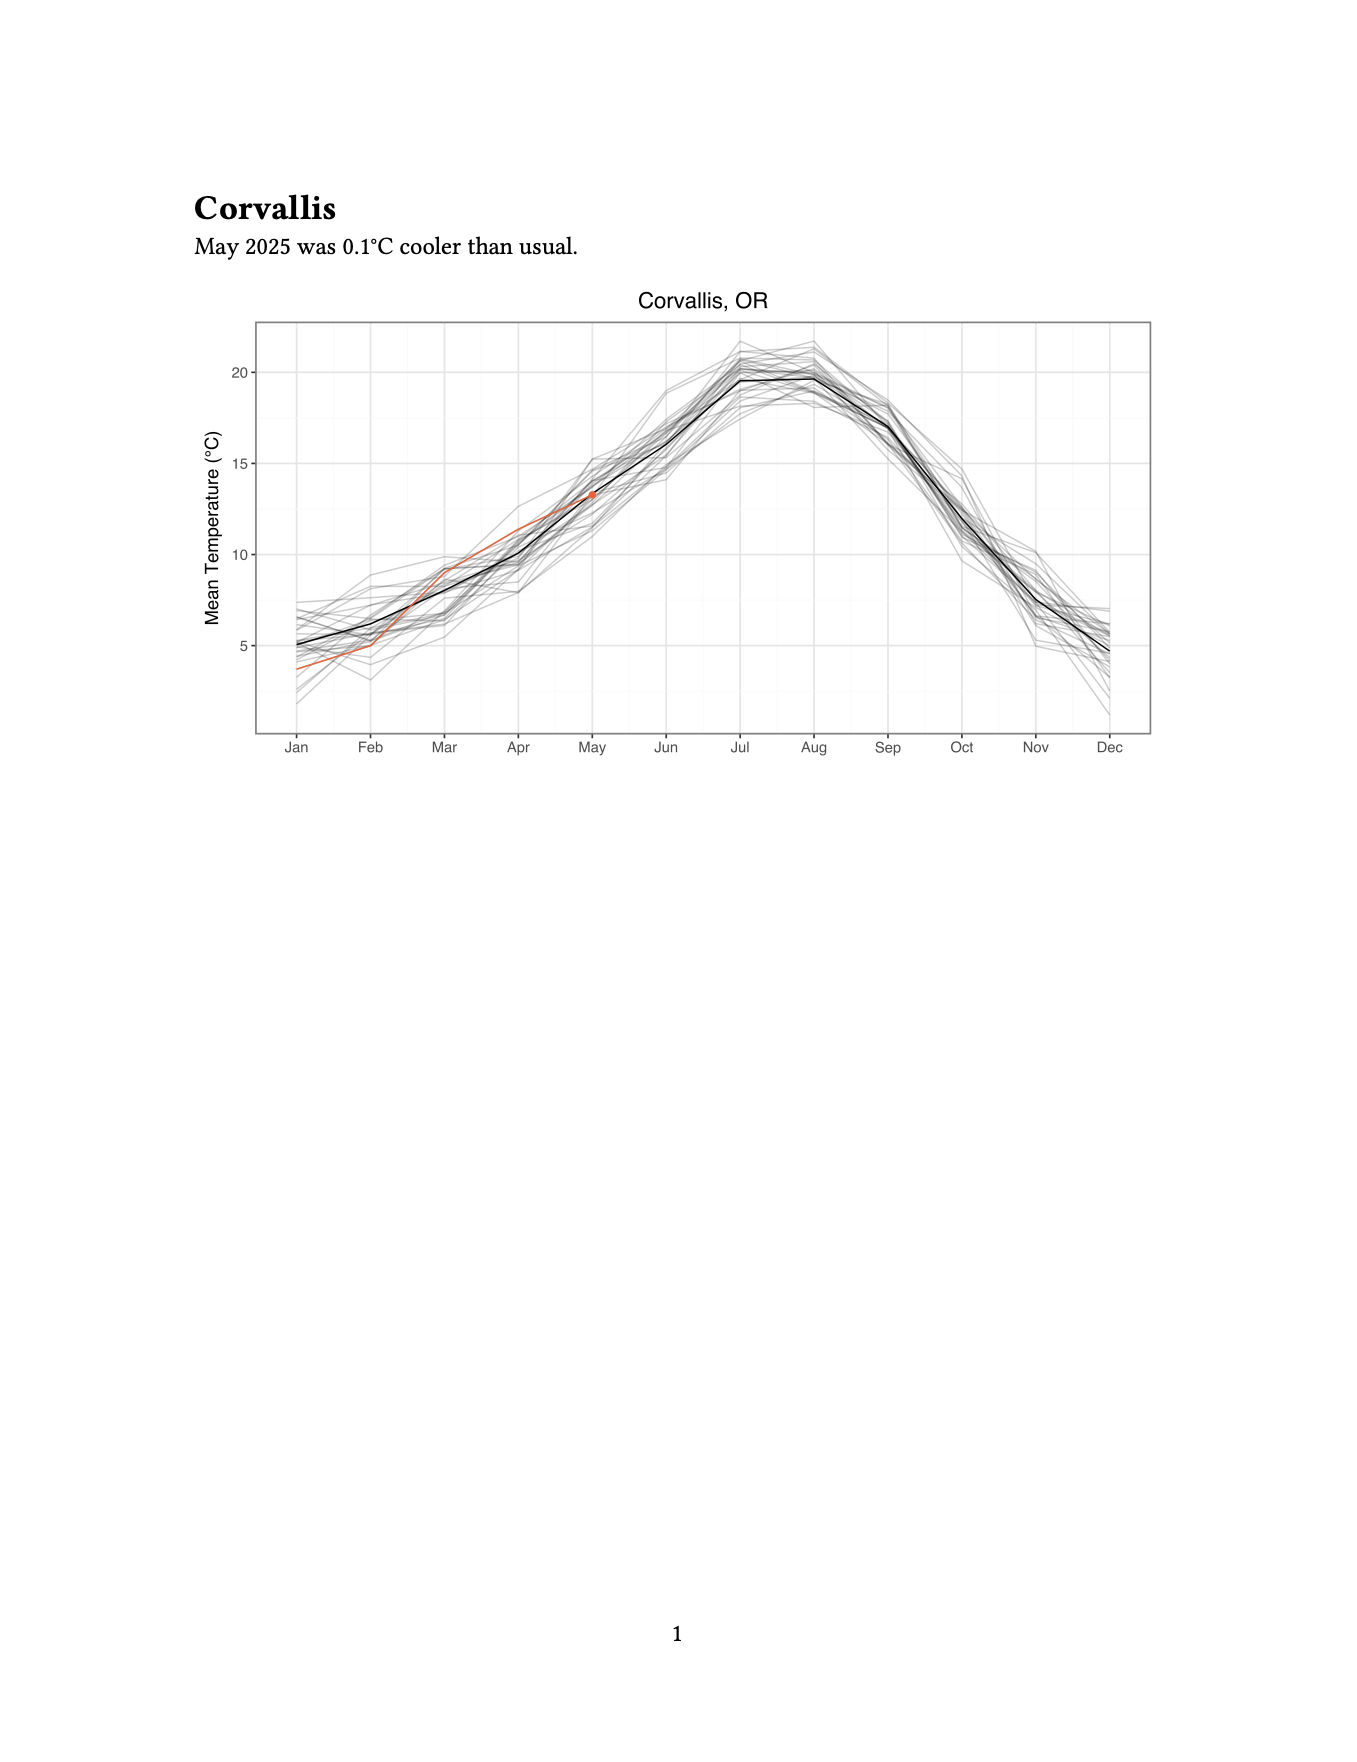
quarto render corvallis.ipynb The result is a PDF file, corvallis.pdf, a simple report with the title “Corvallis” and a single sentence summary of the climate data, along with a plot highlighting the mean temperature for this year against the last 30 years.
corvallis.pdfNow, imagine we want to create this report for the 50 largest cities in Oregon. Here’s the steps we’ll take:
- Turn hardcoded values into variables
- Declare those variables parameters
- Render the notebook with different parameter values
- Automate rendering with many parameter values
1. Turn hardcoded values into variables
We want a report for each city. We’ll start by creating a variable, city, which we’ll designate a parameter in our next step. In a new code cell at the top of our notebook, we define the variable:
code
city = "Corvallis"Then anywhere we previously hardcoded "Corvallis" in the notebook, we replace it with this variable.
The first occurrence is in the title of the document. Originally, we had a markdown cell defining a level 1 heading:
markdown
# CorvallisWe replace it with a code cell that uses an f-string to produce markdown for a level 1 heading based on the city variable:
code
Markdown(f"# {city}")In the filtering step the replacement is straightforward, we just change the string to the variable:
Before:
code
tmean = tmean_oregon.filter(
    pl.col("city") == "Corvallis",
)
After:
code
tmean = tmean_oregon.filter(
    pl.col("city") == city,
)
Finally, the plot code (using plotnine), sets the title of the plot to include the city name:
code
...
+ labs(title = "Corvallis, OR", ...)
...
We can also use an f-string here to include the city variable:
code
...
+ labs(title = f"{city}, OR", ...)
...
Now, we should be able to test our changes by explicitly setting the city variable to something other than “Corvallis” and re-running the cells. Since our report is no longer specific to Corvallis, we can rename it climate.ipynb.
2. Declare those variables parameters
Now we have a variable that represents the parameter, we need to let Quarto know it’s a parameter. Quarto’s parameterized reports are implemented using Papermill, and inherit Papermill’s approach: tag the cell defining the parameter with parameters.
In Jupyter, you can add this tag through the cell toolbar:
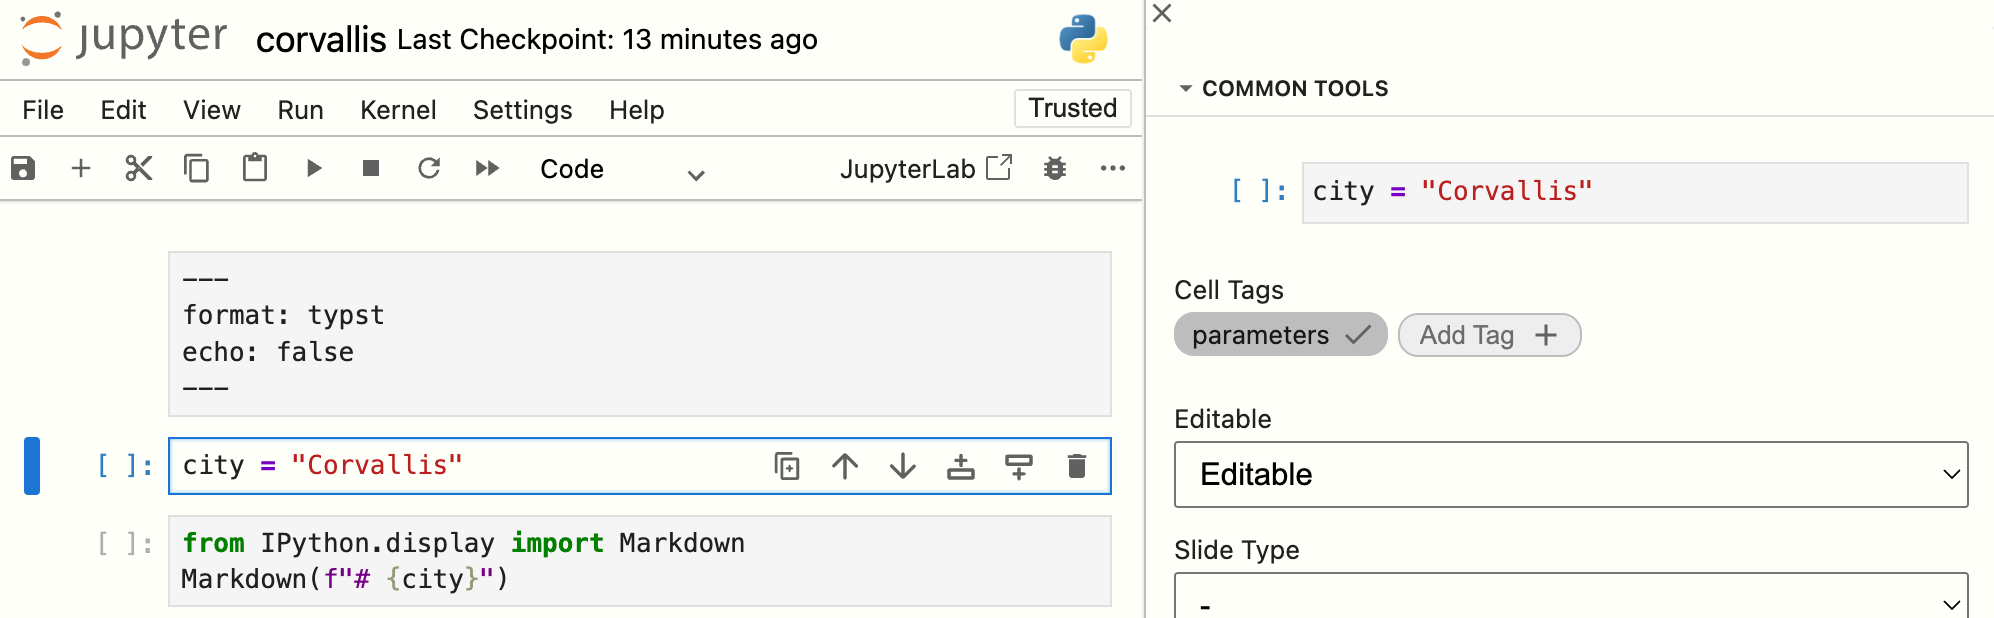
You can see the updated notebook, now a parameterized notebook, on GitHub: climate.ipynb.
3. Render with different parameter values
If we render climate.ipynb, it will still produce the same report for Corvallis, because we haven’t changed the parameter value:
Terminal
quarto render climate.ipynbBut we can now pass parameter values to Quarto with the -P flag:
Terminal
# Generate report for Portland
quarto render climate.ipynb -P city:Portland --output-file portland.pdf

# Generate report for Eugene
quarto render climate.ipynb -P city:Eugene --output-file eugene.pdf
We’ve also added --output-file to ensure each report gets its own filename.
4. Automate rendering with many parameter values
To generate all 50 reports, we need to run quarto render 50 times, each time with a different city as the parameter value. You could automate this in many ways, but let’s use a Python script. For example, you might have a dataset of cities and their corresponding output filenames:
gen-reports.py
cities = pl.DataFrame({
    "city": ["Portland", "Cottage Grove", "St. Helens", "Eugene"],
    "output_file": ["portland.pdf", "cottage_grove.pdf", "st_helens.pdf", "eugene.pdf"]
})
I’ve generated a small example above, but in reality you would likely read cities in from a file. Then you could iterate over the rows of this dataset, rendering the notebook for each city:
gen-reports.py
from quarto import render
for row in cities.iter_rows(named=True):
    render(
        "climate.ipynb",
        execute_params={"city": row["city"]},
        output_file=row["output_file"],
    )
Run this script once, and you’ll get all 50 custom reports!
You can find the complete working example on GitHub: cwickham/one-notebook-many-reports/03-many-reports.
Pretty Reports: Brand and Typst
The steps above to produce parameterized reports apply to any output format supported by Quarto. However, if you are targeting typst you can take advantage of additional features to create beautiful PDF reports.
Brand.yml
Quarto supports brand.yml a way to specify colors, fonts, and logos:
_brand.yml
color:
  palette:
    forest-green: "#2d5a3d"
    charcoal-grey: "#555555"
  foreground: charcoal-grey
  primary: forest-green
typography:
  fonts:
    - family: Open Sans
      source: google
  base:
    family: Open Sans
logo:
  medium: logo.png
Quarto will detect the _brand.yml file and apply the colors, fonts and logo to your report. Colors and fonts in your figures will need to be customized in your code, but that is made much easier with the brand-yml Python package which imports your values from _brand.yml.
You can see a full example of using _brand.yml with climate.ipynb at cwickham/one-notebook-many-reports/04-branded-reports, and learn more about Quarto’s support for brand in the Brand guide.
Typst
Learning a little bit of Typst syntax can take your reports from basic to beautiful. You can include raw Typst syntax in your notebooks, or wrap elements in Typst functions using the typst-function Quarto extension. As an example, you could add a header with the city name and a map of the location:
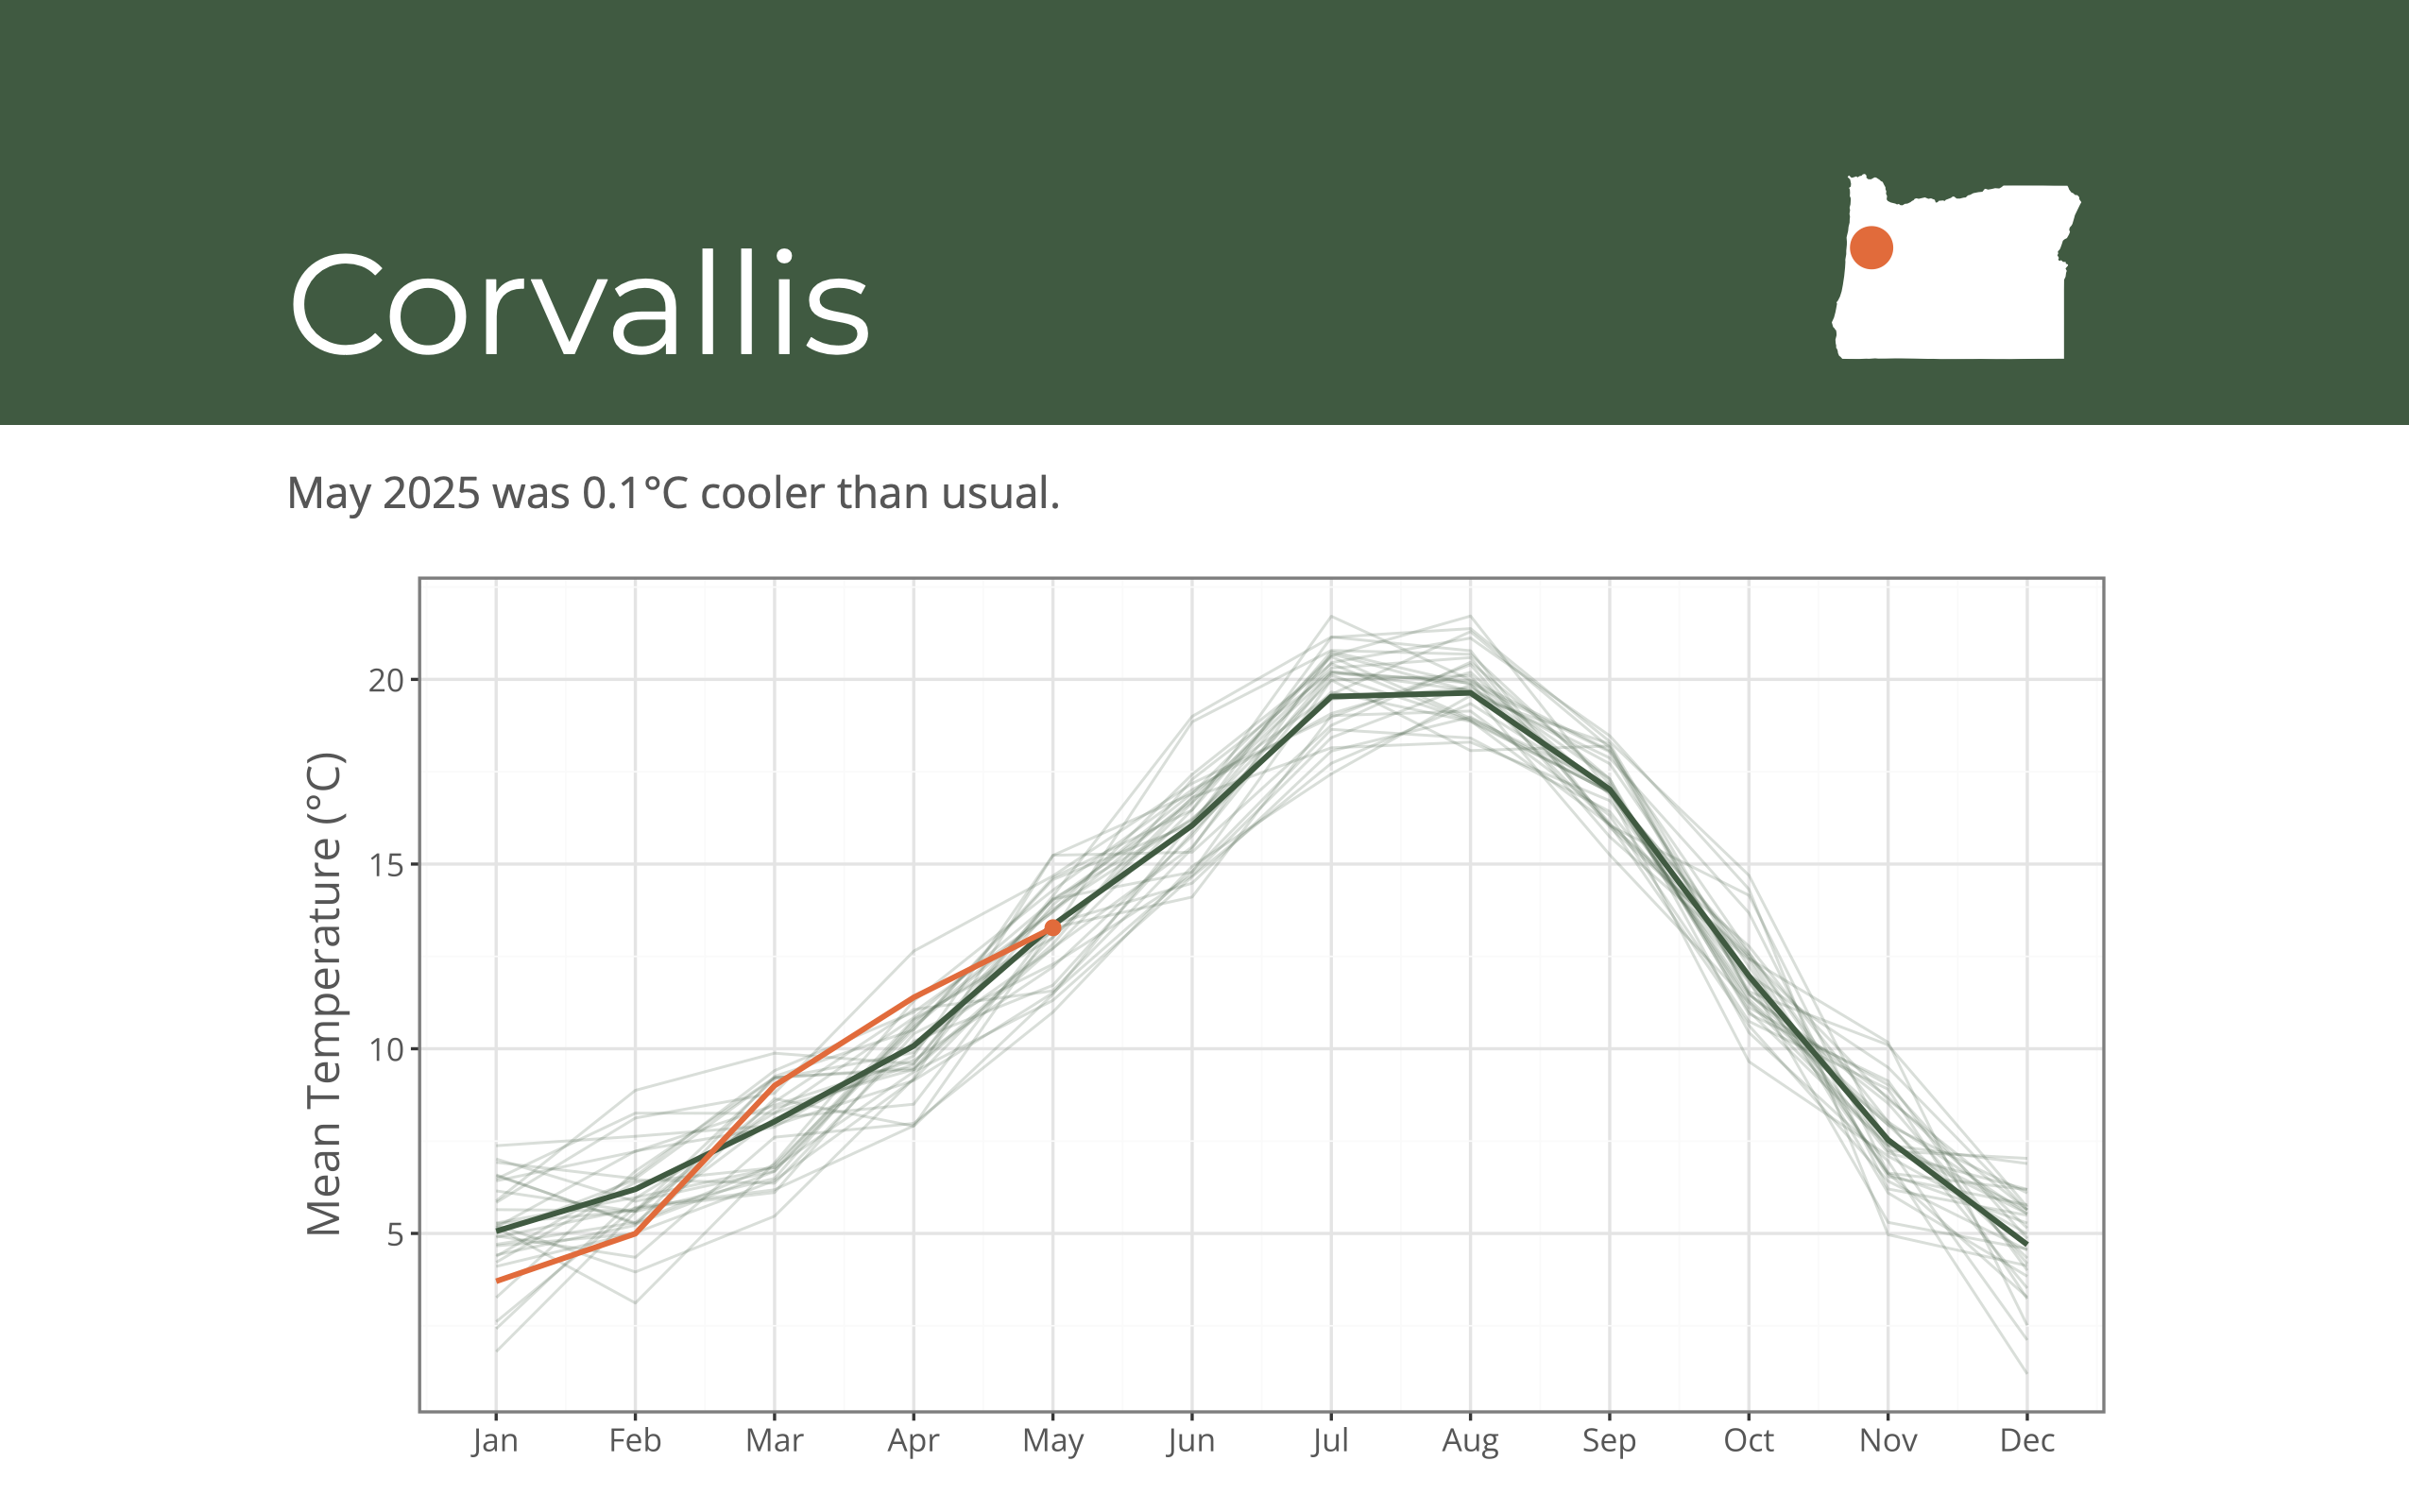
corvallis.pdfYou can see the source for this example at cwickham/one-notebook-many-reports/05-pretty-reports.
jupyter vs knitr
The steps for creating a parameterized report above are specific to documents that use the jupyter engine. With a Jupyter notebook (.ipynb), or a plain text Quarto document (.qmd) with only Python code cells, Quarto will default to the jupyter engine. As described above, the jupyter engine uses cell tags to identify parameters.
If you are working in a .ipynb file, your IDE will likely provide a way to add these tags through the cell toolbar. If you are working in a .qmd file, you can add tags as a code cell option:
```{python}
#| tags: [parameters]
city = "Corvallis"
```
With the jupyter engine, parameters can then be accessed directly as variables, e.g. city, in later code cells.
If you are working in a Quarto document (.qmd) with R code cells, Quarto will default to the knitr engine. With the knitr engine, you set parameters in the document header under params:
---
params:
  city: "Corvallis"
---
In knitr, parameters are accessed as elements of params, e.g. params$city.
You can read more about setting and using parameters in Guide > Computations > Parameters.
Wrapping Up
Parameterized reports turn one notebook into many customized outputs. You’ve seen the process of going from a notebook with a hardcoded value to a parameterized report that can be rendered with different values. You can then automate the rendering in any way you choose to generate dozens of reports at once.